
I built a break-even calculator for SA stores. Here is the uncomfortable thing it revealed.
Almost every store owner we ask can tell us their revenue. Very few can tell us how many units they must sell this month before they earn a cent. The gap between those two numbers is where businesses quietly die.
Break-even is taught badly. It gets presented as an accounting formula, which makes founders file it under “things my bookkeeper handles”. It is not an accounting formula. It is the number that tells you whether today was worth opening the laptop for.
One of the five live-formula sheets in our Excel toolkit is a break-even model built for South African stores specifically – Shopify subscription in rand, gateway fees stacked properly, courier cost per parcel, and the returns rate you keep pretending is zero. Building it taught me something I did not expect.
Start with the R500 sale
We wrote a whole post on what you actually keep on a R500 sale in South Africa. The short version, for a typical Shopify store on the Basic plan taking card payments:
| Line | Amount |
|---|---|
| Sale price | R500.00 |
| Cost of goods (assume 45%) | -R225.00 |
| Gateway fee (3.2% + R2) | -R18.00 |
| Shopify third-party transaction fee (2.0%) | -R10.00 |
| Courier, subsidised delivery | -R60.00 |
| Packaging | -R12.00 |
| Contribution per sale | R175.00 |
R175. Not R275, which is what the 45% cost-of-goods figure suggests to anyone doing the sum in their head. The difference – a hundred rand a sale – is the part nobody models.
Now add the month
Your fixed costs do not care how much you sell. A representative small SA store:
| Fixed cost | Monthly |
|---|---|
| Shopify Basic | R640 |
| Apps (four, kept lean) | R900 |
| Domain, email, misc | R150 |
| Google Ads spend | R6,000 |
| Your time, costed at nothing | R0 |
| Total | R7,690 |
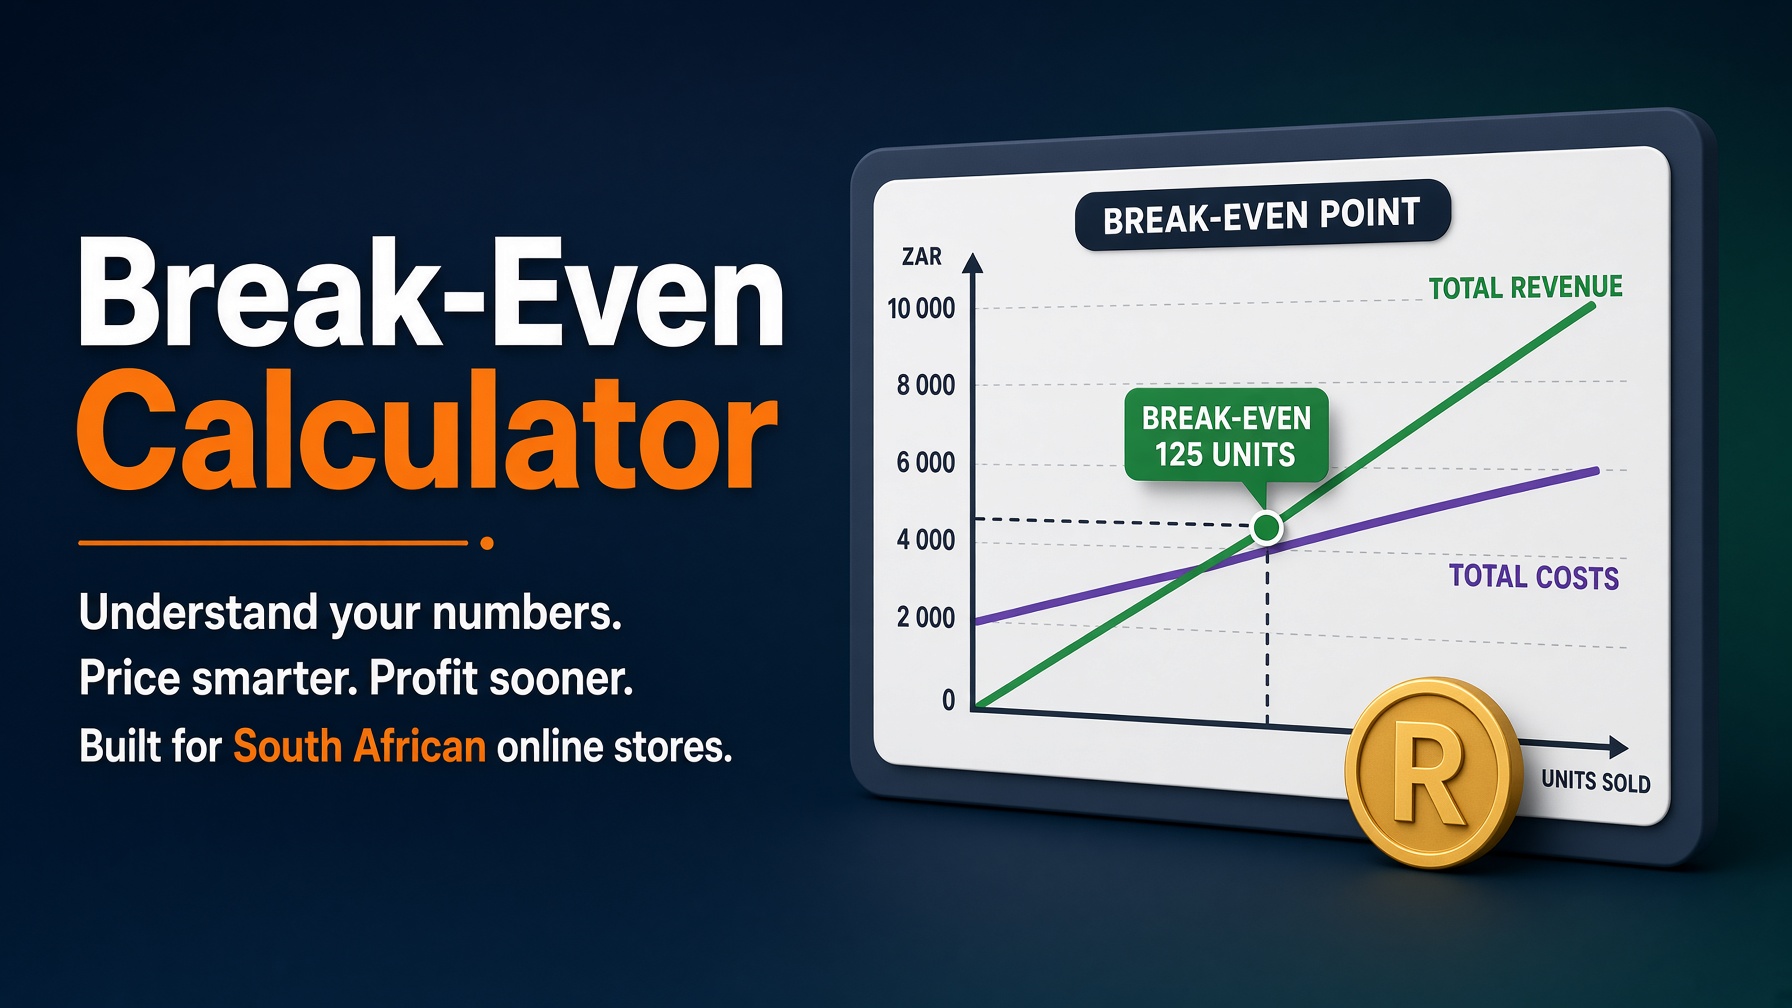
R7,690 divided by R175 contribution is 44 sales a month. Roughly ten a week. That is your break-even, and until you cross it the business is a hobby that consumes money.
The uncomfortable thing
Here is what the model surfaced when I ran sensitivities on it. The break-even point is far more sensitive to the delivery subsidy than to almost anything else.
Drop the courier subsidy from R60 to R30 – by raising the free-shipping threshold from R400 to R750, say – and contribution goes from R175 to R205. Break-even falls from 44 sales to 38. You just removed six sales a month of pressure without touching your ad spend, your product cost, or your conversion rate.
Now try it the other way. Negotiate your cost of goods down by 5% – a genuinely hard commercial win – and contribution rises to R200. Break-even falls to 39. Almost the identical result, for vastly more work.
And the gateway? Switch from a 3.2% + R2 card rate to a 2% instant-EFT rate and you save R8 a sale (R18 down to R10). Break-even moves from 44 to 43. One sale. All that agonising over gateway pricing, and the shipping threshold you set on a whim two years ago is worth six times more.
The shipping subsidy moves break-even most
Sales a month needed to cover R7,690 of fixed costs, before and after each change.
Break-even = R7,690 ÷ contribution per sale (R175 today; R205 after the courier change, R200 after the cost-of-goods change), rounded up.
This is not an argument for ignoring gateway fees. It is an argument for knowing the order of magnitude of every lever before you pull one. Run yours through the Shopify Profit Margin Calculator and the Payment Gateway Comparator.
The returns line you are not modelling
Everything above assumes nothing comes back. In apparel, ten to twenty percent will. A returned R500 order does not cost you R175 of contribution – it costs you the contribution you never earned, plus the courier leg back, plus the packaging, plus the hour spent inspecting and relisting it. Call it R120 of real cost per return.
At a 15% return rate on 44 sales, that is 6.6 returns, or about R790 a month. Which pushes your true break-even to 49 sales. Model it, or it will find you in month four.
Returns push break-even from 44 to 49 sales
Monthly costs to cover at R175 contribution per sale. 15% return rate, R120 per return.
6.6 returns × R120 = R792. R8,482 ÷ R175 = 48.5, rounded up to 49.
Run it on your own numbers
The break-even model, the unit-economics sheet, the ad-budget planner and two more live-formula spreadsheets ship inside the SA eCommerce Bundle 2026 – with the 19-chapter playbook, the 29-page market report, three legal templates and 50 AI prompts. R500 R299 special, instant download.
Pick your own cost of goods, your own courier rate, your own return rate. The numbers above are ours, from real stores. Yours will be different, and the point of the sheet is that you find out which lever matters for your store rather than the one that matters for someone else’s.

We have built 400+ online stores for South African businesses since 2014. Read more about eCommerce development in South Africa.