
Where SA eCommerce growth is actually coming from (five charts from our 2026 report)
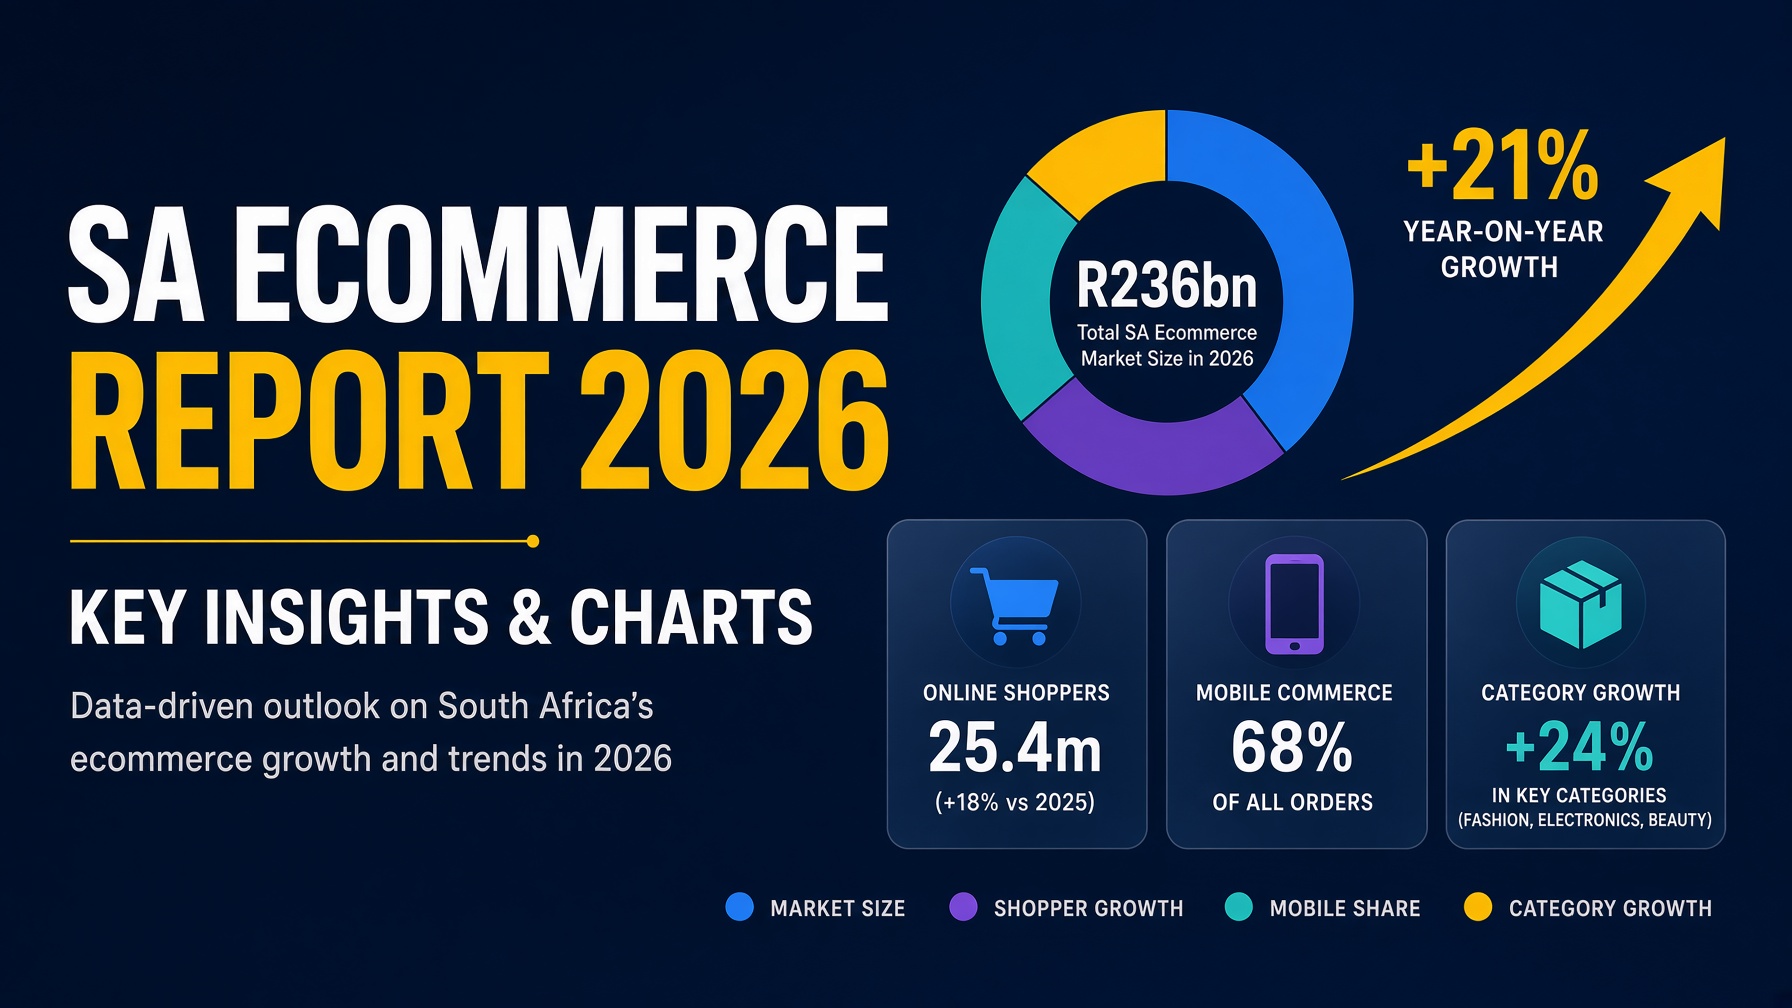
Online retail crossed R150 billion and broke 10% of total retail for the first time. But the aggregate number hides where the growth is really happening – and it is not where most store owners are looking.
We publish a 29-page market report each year inside the bundle. Below are five of its charts, free, with the conclusion each one leads to. Where a number is contested we say so. Sources are at the foot of the page.
1. Online retail turnover, 2022 to 2026
Growth of 20–35% a year, against physical retail below 3%. The line has not bent. What has changed is that the base is now large enough that even the 20% projected for 2026 is about R25bn, a serious rand figure rather than a promising percentage.
2. Online share of total retail
Ten percent is the number that changes boardroom behaviour. Below it, ecommerce is a side channel. Above it, every serious retailer in the country builds a team around it. Expect your competition to get better from here, not worse.
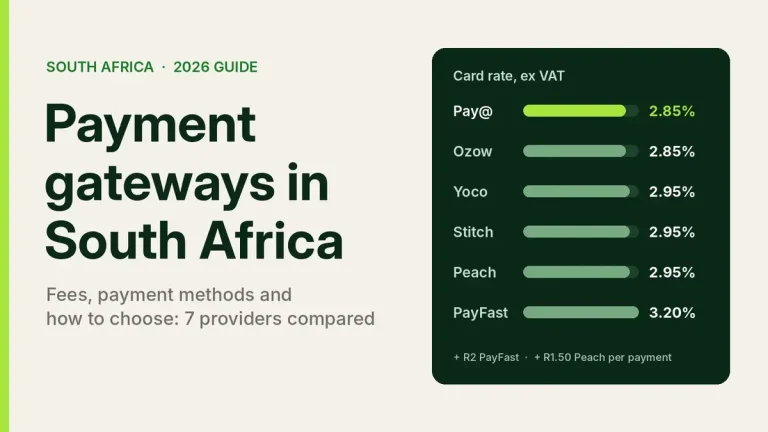
3. The real cost of processing a sale
Headline gateway rates, and then what you actually pay once Shopify’s third-party transaction fee stacks on top – because Shopify Payments is not available in South Africa.
The stacked figure is the one that belongs in your unit economics. Run your own mix through the SA Payment Gateway Comparator before you commit.
4. Growth by segment
This is the chart most store owners have never seen, and the one that should shape where you compete.
Procurement is moving online and almost nobody is building for it. If you sell wholesale, this is the least contested growth in South African commerce right now. See how we build B2B stores.
5. Where the buyers actually are
Eleven million South Africans now shop online, up from about nine million in 2024. The growth is not in Sandton and Sea Point. Mastercard’s SA lead attributes the momentum to smaller towns and middle-income households, as connectivity spreads and secure local payment options become recognisable.
Cross-border fast fashion – Shein and Temu – now accounts for over a third of online apparel spend. If you sell clothing, you are not competing on price. You are competing on trust, delivery speed and service, which happen to be the three things a local store can actually win.
What we would do with this
- Model the stacked processing cost, not the headline rate.
- If you have any wholesale line at all, put it online this year.
- Build for a mid-range Android phone on a patchy connection. That is your median customer now.
- If you sell apparel, stop competing on price with Temu and start competing on the returns experience.
The full 29-page report
Market size, payments, logistics and the regulatory reset – the complete SA eCommerce Report 2026 ships inside the SA eCommerce Bundle, with the 19-chapter playbook, Excel toolkit, legal templates and 50 AI prompts. R500 R299 special, instant download.
Deeper reading: the real state of eCommerce in South Africa.
Sources: World Wide Worx / Mastercard / Peach Payments Online Retail in South Africa report; Stats SA; Mordor Intelligence SA ecommerce outlook; current gateway pricing (2026). Figures rounded. 2026 turnover is a projection. Bar widths are indexed to the largest value in each chart, not to a common scale. Chart 3 adds Shopify Basic’s 2% fee to each percentage rate and leaves out per-transaction rand fees.

We have built 400+ online stores for South African businesses since 2014. Read more about eCommerce development in South Africa.