
The Real State of eCommerce in South Africa (2026)
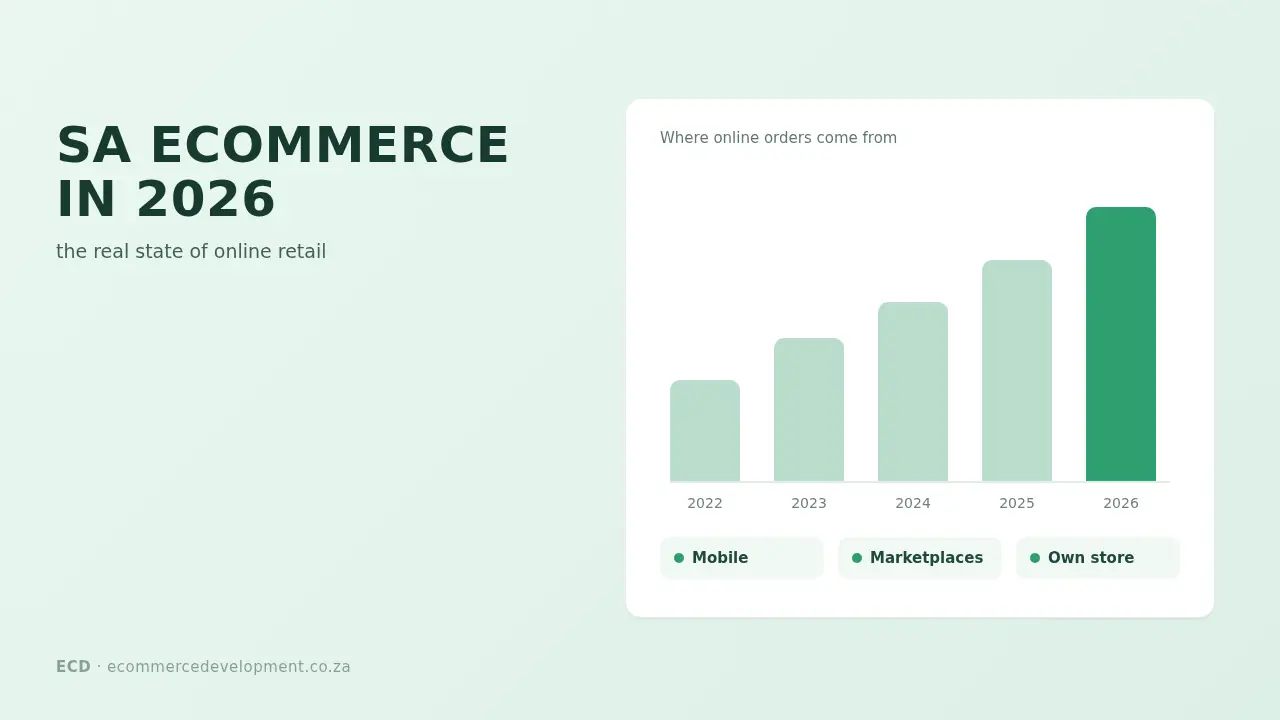
South African online retail reached R96 billion in 2024 and, at about 38% annual growth, roughly R132 billion a year later. It broke 10% of total retail for the first time in early 2026. The market is growing 38% a year while physical retail crawls under 3%. Here is the honest, data-backed picture of where SA ecommerce actually stands in 2026 — and what it means for your store.
Every year someone declares it “the year of ecommerce in South Africa.” For most of the last decade that was wishful thinking. In 2026 it is simply true. The numbers stopped being promising and started being serious — and that changes the maths for anyone selling online in this country.
Below is the real state of play, pulled from World Wide Worx, Mastercard, Stats SA, and current market data — not recycled 2020 lockdown stats. Where a number matters to your bottom line, we have linked the free tool that lets you run it for your own store.
The headline numbers
The full market picture
This post scratches the surface. The SA eCommerce Report 2026 — 29 pages on market size, payments, logistics and the regulatory reset — ships inside our R500 R299 bundle with the 19-chapter playbook, calculators and legal templates.
| Metric | 2024 | 2025–26 |
|---|---|---|
| Online retail turnover | R96bn | ~R132bn (implied by 38% growth) |
| Online share of total retail | ~8% | 10%+ (first time) |
| Annual growth rate | 35% | ~38% |
| Physical retail growth | <3% | <3% |
| South Africans shopping online | ~9m | 11m+ |
Online is now 1 in every 10 rand of SA retail
Share of total retail turnover, online vs physical.
Value shown is the online share. Source: World Wide Worx / Mastercard / Peach Payments Online Retail in South Africa report; Stats SA. Figures rounded.
For context: online retail grew 35% to reach R96 billion in 2024 while physical retail managed under 3%, and 2025 accelerated to an annualised 38%. The market is now valued at roughly USD 42 billion and is forecast to reach USD 63 billion by 2031 — a steady 8.5% compound growth even with load-shedding and customs friction factored in.
Online retail grows about 38% a year. Physical retail, under 3%.
Annual turnover growth, South Africa.
Physical retail is reported as under 3% and drawn at 3%. Source: World Wide Worx / Mastercard / Peach Payments Online Retail in South Africa report; Stats SA.
Forecast: from USD 42bn now to USD 63bn by 2031
Market value, US dollars. About 8.5% compound growth a year.
A 50% rise in total. Sources as listed at the end of this post: World Wide Worx / Mastercard / Peach Payments; Stats SA; Mordor Intelligence SA ecommerce outlook.
The single most important shift: this is no longer a Gauteng-and-Cape-Town story. Mastercard’s country lead notes the momentum has moved into smaller towns and middle-income households as connectivity improves and secure payments spread. Your addressable market is the whole country now, not three metros.
Mobile is not “coming” — it already won
If your store is not genuinely fast and usable on a R2,500 Android phone over a patchy mobile connection, you are losing the majority of your traffic before they see a product. Smartphone adoption sits above 90% of internet users, cheaper data has made image- and video-rich shopping viable, and the bulk of SA orders now come from phones.
This is the number one thing we fix on stores we take over: desktop-first themes that technically “work” on mobile but convert terribly. Speed and mobile UX are not polish — they are the whole game in this market. Curious what poor margins are actually costing you per sale? Run your own figures through our Shopify Profit Margin Calculator.
Payments: the hidden tax on every SA sale
Debit and credit cards still dominate SA online checkout, but the gateway you pick quietly decides how much of each sale you keep. Headline rates hide the real cost. PayFast sits at 3.2% + R2 per card transaction, Yoco around 2.95% flat, Peach 2.95% + R1.50 on its Growth plan, and Ozow’s instant-EFT rate can land closer to 1.5–2%.
There is a catch most SA Shopify owners miss: because Shopify Payments is not available in South Africa, Shopify adds its own 0.6–2.0% third-party transaction fee on top of whatever your gateway charges. Stack those and your true processing cost can sit anywhere from about 2.1% (Ozow EFT on Shopify Advanced) to 5.2% + R2 (PayFast cards on Shopify Basic) per sale. On thin-margin products that is the difference between profit and break-even.
Do not guess this. Put your real volume and product mix through our SA Payment Gateway Comparator to see the exact cost per R10,000 transacted across PayFast, Yoco, Peach and Ozow — including the Shopify stacking fee.
BNPL is the fastest-growing force in the basket
Buy-now-pay-later — Payflex, PayJustNow, Mobicred — has moved from novelty to genuine conversion lever. BNPL transactions are forecast to keep growing double digits a year, and crucially they push average order values 60–70% higher than single-payment purchases. For mid-to-high ticket products, not offering BNPL is leaving real money on the table, especially with younger buyers.
What is still holding the market back
- Load-shedding, though easing, still disrupts both stores and delivery. Resilience planning is now a competitive advantage, not an afterthought.
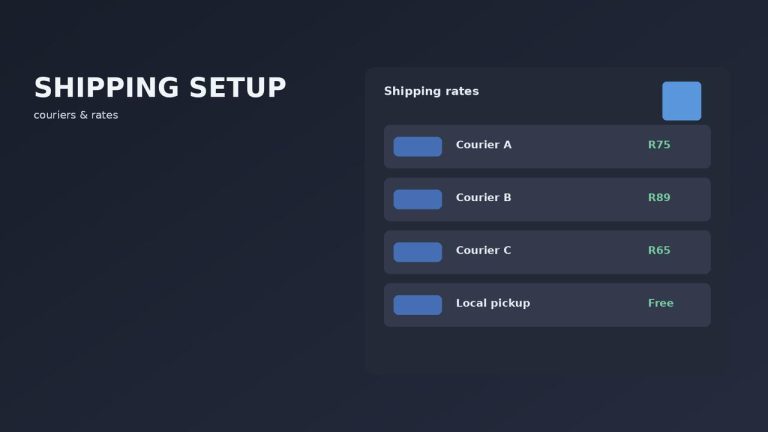
- Last-mile to outlying areas remains slower and pricier — though Pargo, PUDO, The Courier Guy and smart-locker networks are closing the gap fast.
- Trust and returns friction — buyers still hesitate on unfamiliar stores. Clear returns policies and recognisable local payment logos measurably lift conversion.
- Data costs still limit browsing time for lower-income shoppers, which loops straight back to why a lightweight, fast mobile store wins.
Where the growth is actually coming from
Three frontiers are worth watching if you are planning where to compete in 2026:
- B2B / wholesale online — the fastest-growing segment, forecast above 10% CAGR, as procurement moves online. If you sell wholesale, this is your moment — see how we handle it on our B2B eCommerce builds.
- Township and mobile-only commerce — WhatsApp catalogues and smart-locker pickup are unlocking demand that traditional retail never reached.
- Cross-border — fast-fashion players like Shein and Temu now hold over a third of online apparel spend, which is reshaping pricing and pushing local stores to differentiate on service, trust and speed.
What this means for your business
The opportunity has never been bigger — and it has never been more contested. A slow, generic, desktop-first store will get buried. A fast, mobile-first store with SA-native payments, BNPL, sensible logistics and proper SEO can take serious share, because most of your competitors still get the fundamentals wrong.
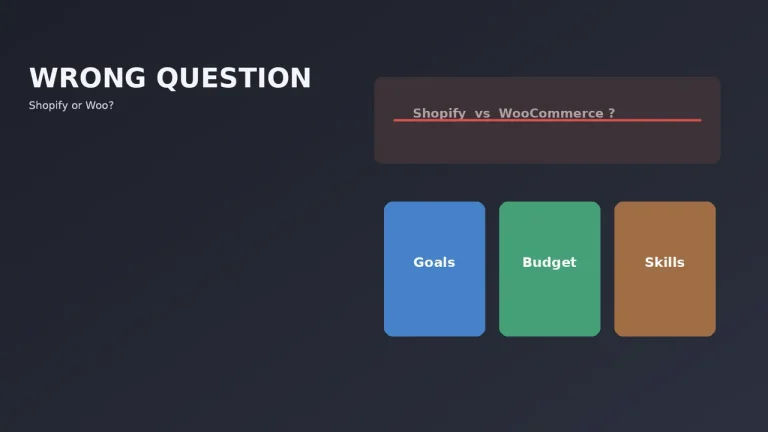
If you are weighing up which platform to build on, our eCommerce Platform Picker gives you a straight answer in about 60 seconds based on your specific situation. And if you are already on the wrong platform, migrating is far less painful — and often far more profitable — than owners expect.
Sources: World Wide Worx / Mastercard / Peach Payments Online Retail in South Africa report; Stats SA; Mordor Intelligence SA ecommerce outlook; current gateway pricing (early 2026). Figures are rounded and subject to change.

We have built 400+ online stores for South African businesses since 2014. Read more about eCommerce development in South Africa.